7 Construction KPIs Every Small Contractor Should Track
June 18, 2026 · The Instant File Co Team
The seven construction KPIs every small contractor should track are gross profit margin per job, job cost variance, net cash flow and runway, schedule performance, change order margin, labor productivity, and rework rate. Track these seven and you will know whether each job is actually making money, whether you can make payroll next month, and where profit is leaking, all before the problem shows up in your bank balance. You do not need expensive software to do it. A single spreadsheet you update once a week is enough.

What are construction KPIs (and why small contractors need them)
A construction KPI (key performance indicator) is a single number that tells you whether part of your business is healthy or in trouble. Revenue alone does not. You can book a record month and still lose money on every job if your margins are wrong, your crews are slow, or change orders are going out unpriced.
The myth is that KPIs are a big-company thing for commercial projects with a dedicated PM. They are not. A residential remodeler or a two-crew trades business gets more value from tracking the basics, because on a smaller operation one bad job can wipe out the profit from three good ones. Most experts recommend a small contractor track five to seven KPIs that hit their biggest pain points first, usually cash and margin.

Construction KPI benchmarks at a glance
Here is the quick-reference table. Targets vary by trade and region, so treat these as starting benchmarks, not hard rules.
| KPI | How to calculate it | Benchmark to aim for |
|---|---|---|
| Gross profit margin per job | (Revenue minus direct job costs) / revenue | 25% to 35% |
| Job cost variance | (Actual cost minus estimated cost) / estimated cost | Within plus or minus 5% to 10% |
| Net cash flow / runway | Cash in minus cash out; cash on hand / monthly burn | Positive; 3+ months runway |
| Schedule performance | Actual progress / planned progress (or % jobs on time) | 1.0 or higher (90%+ on time) |
| Change order margin | (Change order revenue minus cost) / change order revenue | Match or beat base job margin |
| Labor productivity | Labor cost / revenue | 20% to 35% (trade dependent) |
| Rework rate | Rework hours or cost / total hours or cost | Under 5% |
1. Gross profit margin per job
This is the single most important number in your business. Gross profit margin is what is left after the direct costs of doing the work: materials, labor, subcontractors, and equipment. The formula is simple: take revenue, subtract direct job costs, then divide by revenue. A $40,000 job that costs you $28,000 to deliver has a 30% gross margin.
For most general contractors and trades, 25% to 35% is healthy. Track it per job, not just across the whole year, because a blended average hides the losers. The job you remember as "busy" is often the one that quietly ran at 12%. When you see a job dip below your target, you can dig into why while you still have time to fix the next bid.
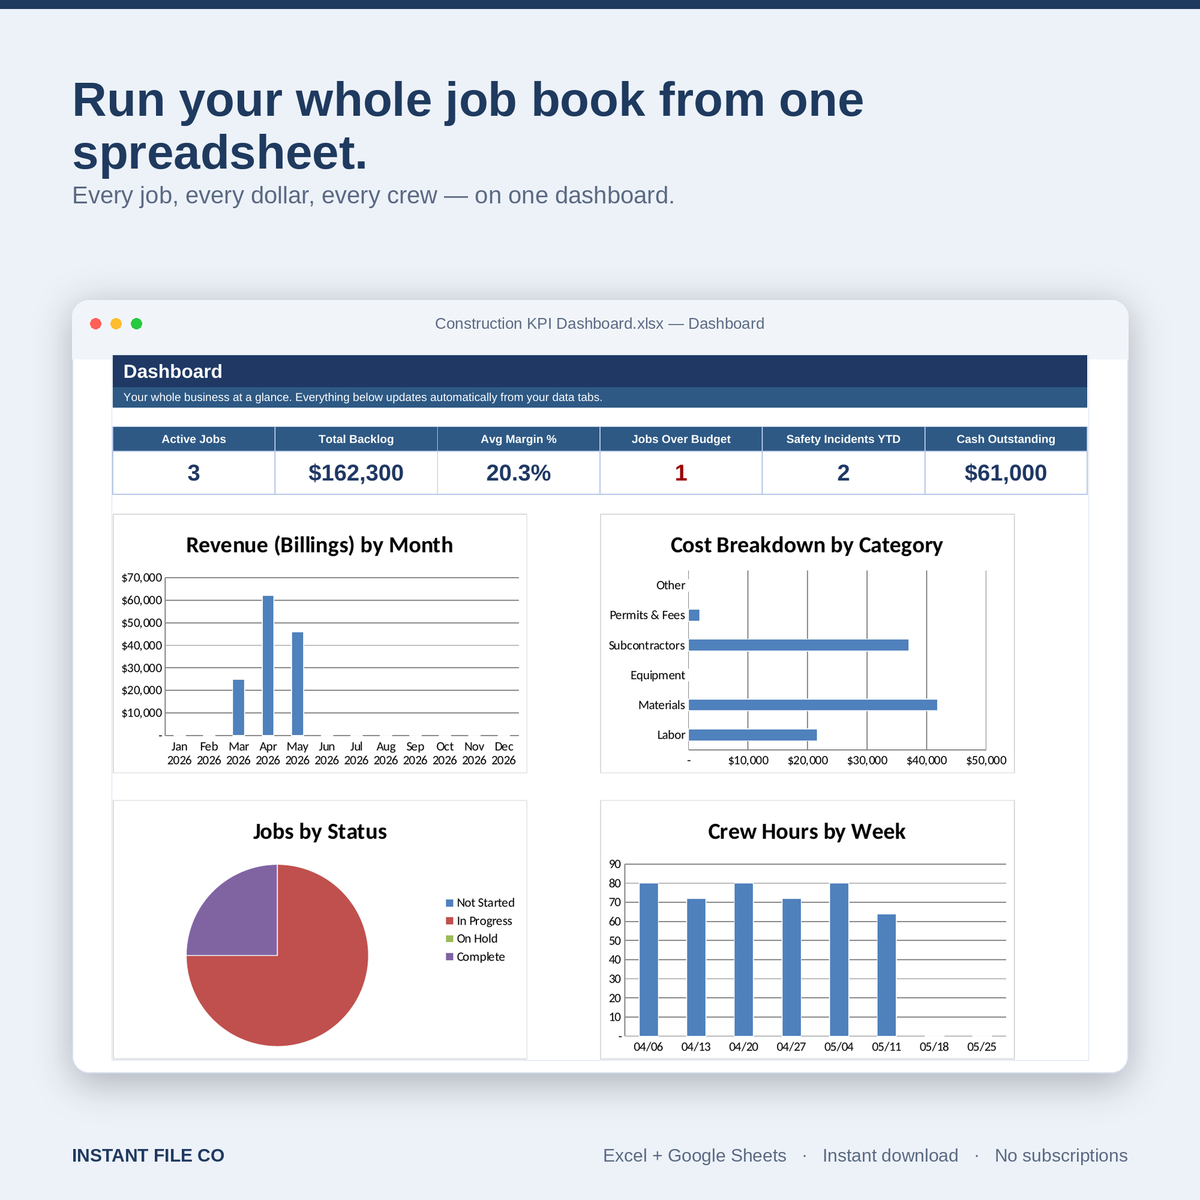
Drop in your job numbers and the dashboard does the margin, variance, and crew math for you. Works in Excel and Google Sheets. No logins, no subscriptions.
2. Job cost variance (estimate vs actual)
Job cost variance answers a brutal question: how good is your estimating? Take what a job actually cost, subtract what you estimated, and divide by the estimate. If you bid $28,000 and spent $31,500, that is a 12.5% overrun, and it came straight out of your margin.
A well-run small contractor keeps variance within plus or minus 5% to 10%. Tracking it does two things. It tells you which jobs are bleeding mid-project so you can correct course, and over time it tells you which parts of your estimates are consistently wrong, so your next bids get sharper. Estimating is a skill that compounds. You only improve it if you measure it.
3. Net cash flow and months of runway
Running out of cash is the number one reason small businesses fail, and construction is especially exposed because you often pay for materials and labor weeks before the client pays you. Net cash flow is simply the money that came in minus the money that went out over a period. Runway is your cash on hand divided by your average monthly burn, which tells you how many months you can survive if the work stopped tomorrow.
Aim for positive monthly cash flow and at least three months of runway. A profitable contractor can still go under if a slow-paying client and a big material order land in the same week. Watching cash flow weekly, not at tax time, is what lets you see that squeeze coming.

See exactly how many months of cash you have left and what is driving the burn. Cash flow and burn rate in one tracker for Excel and Google Sheets.
4. Schedule performance (on-time completion)
Late jobs cost you twice: once in penalties or unhappy clients, and again because your crew is not on the next paying job. The formal version of this KPI is the Schedule Performance Index (SPI), which compares the work you planned to have done by now against the work actually done. An SPI of 1.0 means you are exactly on schedule, above 1.0 means ahead, below 1.0 means behind.
If SPI feels like overkill for a small shop, use a simpler version: the percentage of jobs finished on or before the promised date. Aim for 90% or better. Either way, the point is to catch slippage in week two, not at the final walkthrough when it is too late to recover.

5. Change order margin and frequency
Change orders are where contractor profit quietly leaks, and where client disputes start. Extra work gets done on a handshake, the invoice never goes out, or it goes out without markup. Two numbers keep this under control. Change order frequency tells you how often scope is changing (a high rate can signal weak initial estimates or scope creep). Change order margin tells you whether that extra work is actually profitable.
Every change order should match or beat your base job margin, because it is usually higher-value, lower-competition work. The fix is process: document the change, price it, get written approval, and log it before anyone picks up a tool. Contractors who digitize this go from an average of 24 days to price a change down to about 3.5 days, and they stop giving away free work.
Log every approval, cost, schedule change, and profit impact in one place, so no change order goes unbilled. Excel and Google Sheets.
6. Labor productivity (labor cost as a percent of revenue)
Labor is usually a contractor's largest controllable cost, so a small swing here moves your whole margin. The cleanest way to track it for a small business is labor cost as a percentage of revenue: total labor cost divided by revenue for the job or the month. Depending on the trade, 20% to 35% is a common healthy range. Labor-heavy trades sit higher; material-heavy ones sit lower.
Watch the trend more than the single number. If labor cost percentage is creeping up while your bids stay flat, you are either underbidding, losing hours to rework, or running crews inefficiently. That is your cue to look at scheduling and estimates before the next quarter.
7. Rework rate
Rework is work you already paid for once and now have to pay for again. It rarely shows up as a line item, which is exactly why it is dangerous. Track it as rework hours (or rework cost) divided by total hours (or total cost), and aim to keep it under 5%.
Even rough tracking helps. Jot down when a crew goes back to redo something and why. After a month you will see patterns: a specific step, a specific sub, a specific kind of job. Rework rate is the KPI that turns "we just seem to lose money on bathrooms" into a fixable, measurable problem.
How many KPIs should a small contractor track?
Start with five to seven, not twenty. A dashboard nobody updates is worse than no dashboard, because it gives you false confidence. If cash is your tightest constraint, start with gross margin, job cost variance, and cash flow, then add the rest as the habit sticks. The goal is a number you check every week and actually act on, not a spreadsheet you build once and abandon.
Frequently asked questions
What is the most important KPI for a construction company?
Gross profit margin per job is the most important construction KPI, because it tells you whether the work itself is profitable before overhead. For most general contractors and trades, a healthy gross margin sits between 25% and 35%. If you only track one number, track this one per job.
What is a good profit margin for a small contractor?
A good gross profit margin for a small contractor is 25% to 35%, which is the share of revenue left after direct job costs like materials, labor, and subcontractors. Net profit margin, after overhead, is typically lower, often in the high single digits to mid teens depending on the trade and how lean the business runs.
How do I track KPIs without expensive construction software?
You can track every core construction KPI in a spreadsheet. Enter your job costs, revenue, and dates, and let formulas calculate margin, variance, cash flow, and schedule performance for you. A done-for-you template in Excel or Google Sheets gives you the structure without the monthly software fee, which is why many small contractors start there.
How often should a contractor review their KPIs?
Review cash flow and active job margins weekly, and review the full KPI set monthly. Weekly checks catch cost overruns and cash squeezes while you can still act on them. The monthly review is where you spot trends across jobs, like labor creep or rising rework, and feed them back into your next bids.
Related guides and tools
- Browse the Construction Project Management templates for estimating, scheduling, and job costing.
- Top tools: the Construction KPI Dashboard, the Contractor Change Order Tracker, and the Cash Flow Forecast and Runway tracker.
- Related guide: Warehouse KPIs: the 10 metrics every supervisor should track monthly.
Track all 7 KPIs without building a spreadsheet from scratch
The Construction KPI Dashboard does the math the moment you enter your job numbers. Built by an operator, not a designer. Works in Excel and Google Sheets.
Get the Construction KPI Dashboard →One-time payment. Lifetime updates. 14-day money-back guarantee.