Manufacturing OEE & Downtime Tracker (Excel & Google Sheets)
$29.00
Digital
14-day money-back guarantee
Full refund if you haven't used the file yet — just email Craig within 14 days. Real reply, no hoops.
- Delivered to your inbox in 60 seconds
- One-time payment — lifetime updates
- Real human support — talk to Craig directly
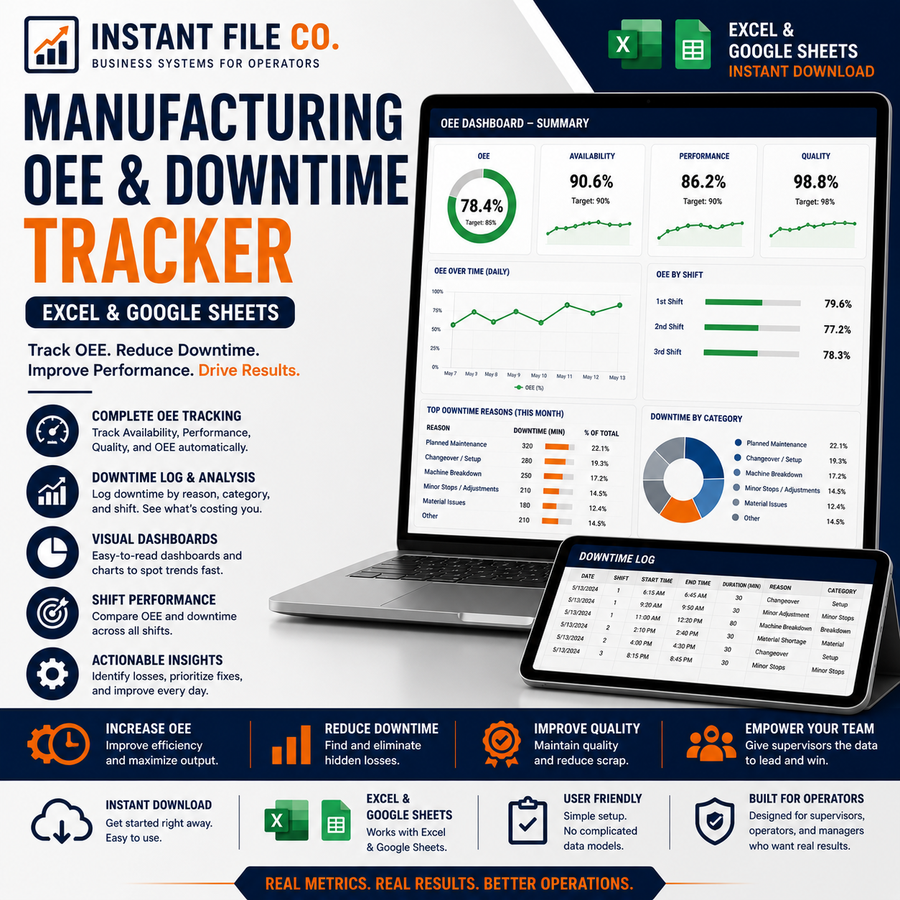
Track Overall Equipment Effectiveness (OEE) and downtime in minutes a day. A ready-to-use spreadsheet for production managers, lean/CI teams, and plant supervisors. Works in both Microsoft Excel and Google Sheets — no add-ons, no macros, no subscriptions.
What's inside
- Dashboard — live KPI cards for OEE, Availability, Performance, and Quality, plus charts for OEE by machine, downtime Pareto, and an OEE trend line.
- Production Log — enter one row per machine, per shift. Availability, Performance, Quality, and OEE calculate automatically. Built-in dropdowns and color-coded OEE.
- Machine setup — add your machines and their ideal run rates once; the log handles the rest.
- Downtime reason codes — standard planned/unplanned reasons, fully editable.
How it works
OEE = Availability × Performance × Quality, calculated using the industry-standard method. Just fill in the blue input cells (planned time, downtime, total and good units) and every metric updates instantly.
Details
- Format: .xlsx (opens in Excel and uploads straight to Google Sheets)
- Pre-loaded with sample data so you can see it working — clear it and start logging
- Instant digital download after purchase
One-time purchase. Lifetime use. No recurring fees.
Pairs well with
Complete the toolkit
 eBook
eBook
OEE for Shift Supervisors: Managing People, Not Just Machines (Guide)
The number doesn't move because you measured it — it moves because the crew...
$39.00
Manufacturing OEE & Downtim...$29.00